In an industry-first, Dealerslink has just released its nationwide retail pricing heat map.
A heat map is a graphical representation of data where values are depicted by color. Heat maps make it easy to visualize complex data and understand it at a glance.
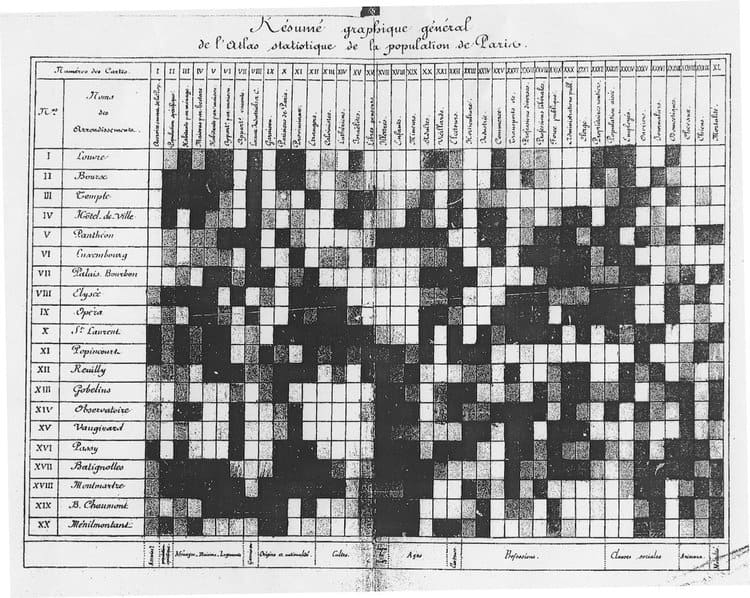
The practice of heat mapping originated in the 19th century. Manual gray-scale shading was used to depict data patterns in matrices and tables.

The Auto Industry’s First National Pricing Heat Map
Keeping with the Dealerslink philosophy of simple intuitive design and powerful car-selling tools, this new geo-mapping capability will bring split-second decision making power to sales managers, and expose regional hot spots for buying vehicles at the best prices.
It’s great to have a lot of data when evaluating the market — and we do — but nothing makes the data more usable than clear visuals. That’s what we’ve created for the first time here.
Dealerslink Senior UI Developer Tony Bebber.
Retail Pricing
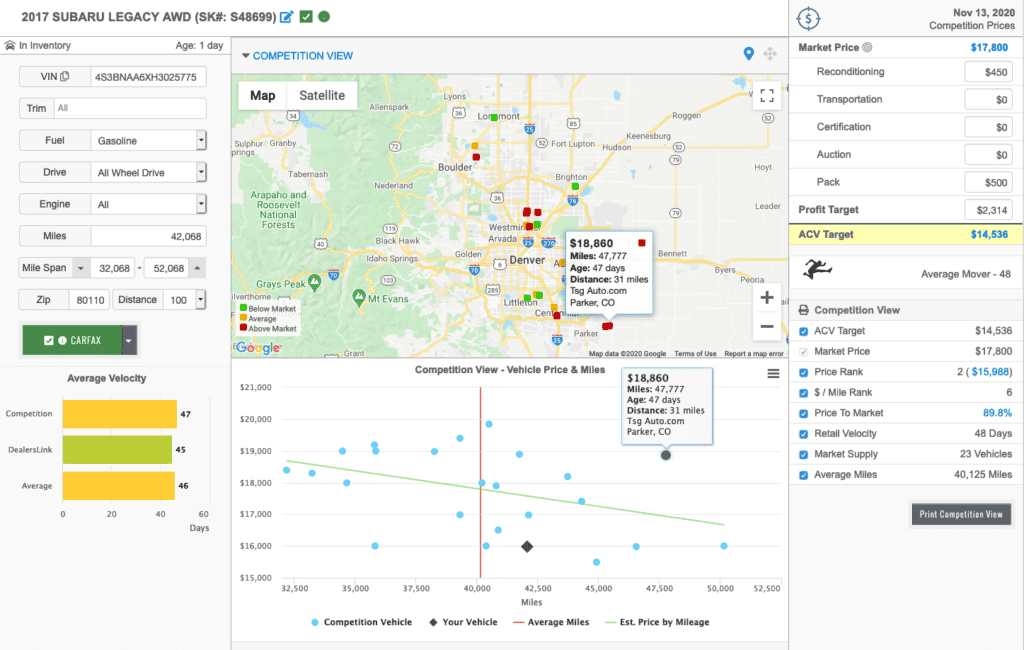
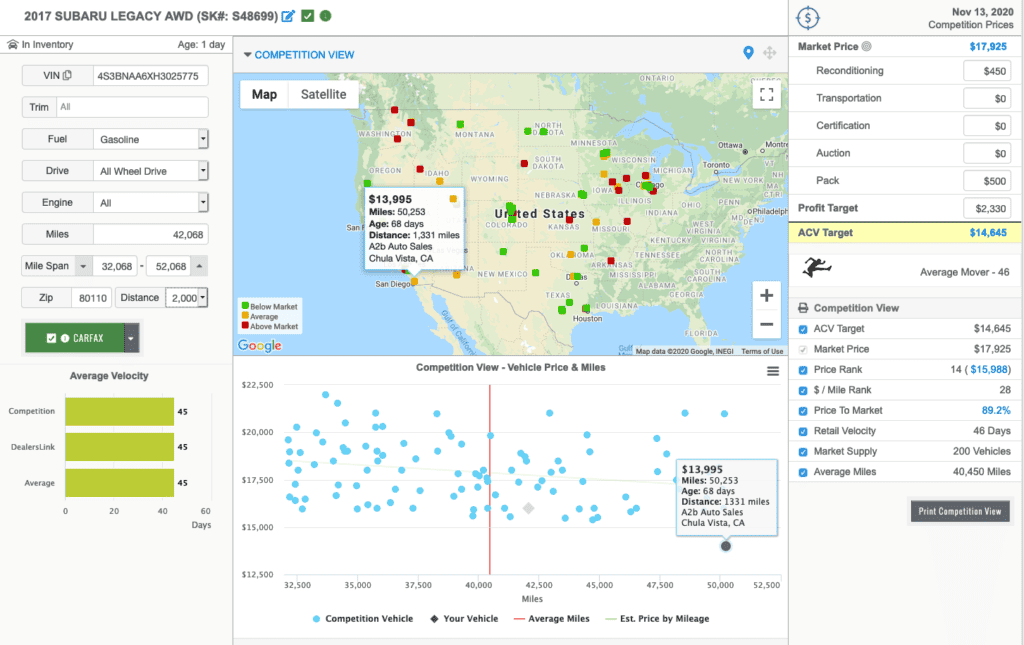
By aggregating retail pricing from over 50,000 dealerships nationwide, Competition View can geo-plot vehicle retail pricing with color-coding so you can quickly compare regional markets and identify which competitors are aggressively pricing their units.

Vehicles priced below market average are shown in green. Vehicles close to average are yellow and vehicles higher than average are red.
The Competition View Heat Map expedites retail data analysis and gives an at-a-glance understanding of how other dealers are pricing similar vehicles, helping to identify trends and optimize vehicle pricing for maximum profit. This is a GAME CHANGER!!
Dealerslink CEO Mike Goicoechea
Wholesale Stocking
Dealerslink dealers have long known that you make money on the buy. Sourcing and selling vehicles outside your local market lead to higher retail and wholesale profits.
With Heat Map, you can now clearly see variations in similar vehicle pricing based on location. Dealerslink is the first to offer this level of nationwide competition pricing transparency.

Leverage nationwide wholesale markets and buy units from the lowest priced regional markets and sell into higher-priced markets.
The Dealerslink Heat Map builds upon Competition View, the most in-depth retail market analysis tool in the industry. This is the latest in a string of innovations by Dealerslink, including the MotorCloud vehicle trade-in app, OEM Build Data, retail pricing automation, and the NADA pre-book report.
To see Competition View Heat Map in action, give us a call at 844-340-2522 or request a live demo.


