Big data. You’ve probably heard the term and have a general idea of what it means. Basically, big data refers to extremely large sets of data that can be analyzed to reveal patterns, trends and specific insights.
But what can big data do for auto dealerships? A lot, if you have an analytical tool that can reveal those patterns and specific insights to help you better manage your inventory.
In the digital age, consumers can now research exactly what vehicles they want, see how many are in the market, and see what price they should pay. To stay competitive, dealerships should begin aggressively promoting their retail units online with market-based pricing. This will get you more views of your inventory, increase your chances of selling vehicles, and help you get the maximum profit your market will allow.
The key is analytics, defined as “the analysis of data by the use of mathematics, statistics and computer software.” There are many analytical tools available, including our Dealership Analytics with live-market pricing.
Here are three ways that analytics can help your dealership:
- Buy the right inventory – Data will show you what models are selling in your market, leaving out any guesswork on your part.
- Price your inventory right – Knowing exactly how your competition is pricing their inventory will keep you from overpricing yours. This can also eliminate standard markup across all vehicles (e.g., every used car gets a $4,000 markup regardless of vehicle type, mileage, competition, etc.). In a previous blog post, we examined three metrics that can be used to make smart decisions about used-vehicle pricing.
- Increase turn time – Vehicles with turn times under 60 days hold their markup better and offer the greatest potential profit. Increasing turn time also helps keep inventory fresh.
 |
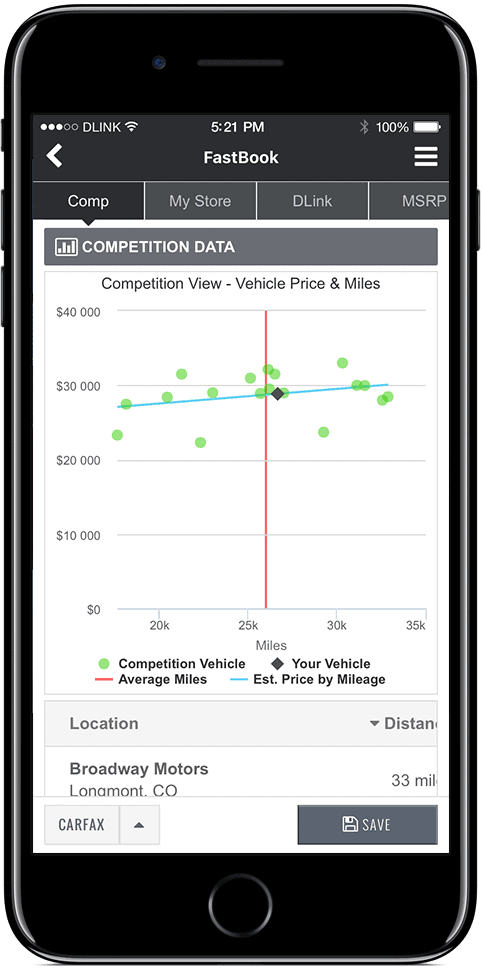
| Competition View allows you to see exactly how other dealers are pricing similar inventory. |
To help you buy, price and sell used vehicles, Dealership Analytics provides several useful reports:
- Stocking Report – Analyzes the sales history of your store and your retail market, generating an ideal inventory mix. This can help keep you from buying inventory that doesn’t sell well in your market.
- Velocity Report – Based on vehicle turn rate and market saturation, velocity reports compile complex live-market data points into an easy-to-read format that enables you to identify and source units with the highest retail potential in your market.
- Competition View – This allows you to see exactly how your competition is pricing similar inventory. Dealerslink scans over 22,000 dealership websites and third-party classified sites daily for the most accurate retail pricing data on any unit in your region.
- Health Reports – Broken down by vehicle type, make, model and year, this report presents inventory-aging trends for your store vs. your retail market inventory and age relative to past performance and industry-leading peers.
- Vehicle Grade – Using average velocity, market supply, competition pricing, vehicle miles and options, this report assigns an easy-to-read grade to a vehicle so you know if it’s a good buy or trade. This is especially helpful when sourcing inventory from an auction or a customer trade.
- NADA Pre-Book Report – Allows you to preview next month’s book values a week before they update. This report shows which units will be most affected, allowing you to take proper pricing action.
Remember that knowledge is power, and used-vehicle analytics can help you become the most knowledgeable dealership in your market.
If you have questions about our Dealership Analytics, or want further explanations about these reports and how best to use them, feel free to contact us at 844-340-2522, or email sales@Dealerslink.com.


